ANALYSIS OF NATIONAL TAX REVENUE – AUGUST 2019  Data as of 08/31/2019

ANALYSIS OF NATIONAL TAX REVENUE – AUGUST 2019 Data as of 08/31/2019

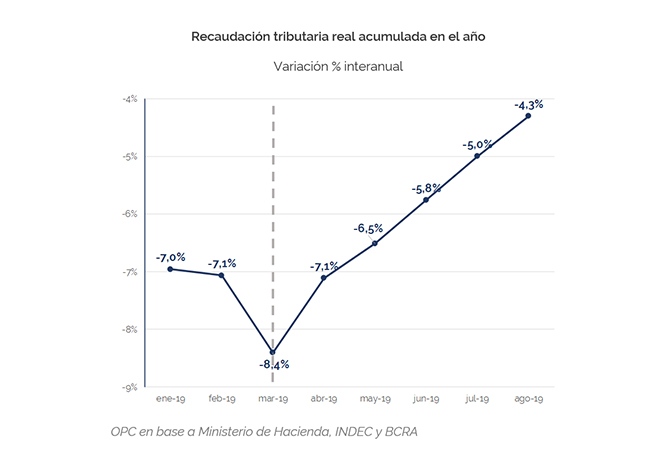
National Public Sector revenues grew nominally in August compared to the same month of the previous year and, for the first time in over a year, recorded an increase in real terms, confirming the improving trend that had been outlined in previous months.

This situation is mainly explained by the boost given to tax collection by Export Duties and Wealth Tax, whose contributions exceeded inflation in the year-on-year comparison.

On the other hand, the main drop of the month was recorded in Social Security, because of the contraction of the wage bill and regulatory changes affecting contributions.

A total of AR$458.5 billion was collected in August, which implied a nominal year-on-year growth of 56.3%. The year-on-year variation was 48%.

It is estimated that the different fiscal measures announced by the Executive Power at the end of last month will have a cost of AR$86.9 billion for the remainder of the year.

FISCAL RELATIONS BETWEEN THE NATION AND THE PROVINCES  Evolution from 1993 to date

FISCAL RELATIONS BETWEEN THE NATION AND THE PROVINCES Evolution from 1993 to date

The analysis of the fiscal relations of the Nation and the provinces between 1993 and 2018 reveals a significant increase in provincial own tax resources, as well as in transfers received from the central government: the federal states gained share in the allocation of total tax resources by virtue of agreements between jurisdictions and changes in the tax structure.

  • Between 1993 and 2018, total tax burden increased by 9 percentage points, from 19.6% to 28.6% of GDP.
  • The fiscal year 2015 was the one with the highest tax burden of the term 1993-2018, when it reached a maximum of 31.1% of GDP.
  • Provincial tax resources increased from 3.4% of GDP between 1993 and 2001 to 5.3% between 2013 and 2018. This increase was surpassed by the increase in expenditures, partly financed by higher transfers from the central government.
  • The percentage of own taxes in total resources went from a maximum of 82.3% (Autonomous City of Buenos Aires) to a minimum of 4.7% (Formosa).
  • Transfers by Federal Co-participation and special laws went from 5% to 7.5% of GDP in that period and showed growth trend, except for the 2001-2003 term. But own resources moved along the same line, which does not necessarily imply greater provincial dependence on the central government.
  • In the 2015-2018 term, only three provinces (the Autonomous City of Buenos Aires, the Province of Buenos Aires and Neuquén) had sufficient own resources to cover their expnediture on personnel.

Since 2003, there has been a sustained growth in automatic transfers from the national government.

REPORT ON NATIONAL PUBLIC INVESTMENT BUDGET EXECUTION – Second quarter 2019

REPORT ON NATIONAL PUBLIC INVESTMENT BUDGET EXECUTION – Second quarter 2019

During the second quarter of 2019, public investment totaled AR$41.98 billion, showing a drop in its relative allocation, both as a proportion of total expenditure (5.71% to 3.66%) and in terms of GDP (0.33% to 0.20%).

The composition by geographic region shows a heterogeneous pattern, with a high concentration in the Pampas region (50.0% of the total). The investment “without specified region” accounts for an additional 16.9% – due to the significance of the Inter-provincials -, followed by the Northwest Region (13.5%), the Patagonian Region (8.0%), the Northeast (7.1%) and Cuyo Region (4.5%).

In terms of physical progress, 50.8% of the works show a minimum degree of progress (less than 20%), 5.3% show a low degree of progress (between 20% and 40%), 10.3%, medium-low progress (between 40% and 60%), 6.3%, medium-high progress (between 60% and 80%) and another 16.6%, high progress (greater than 80%), while there are 10.7% of works for which no physical execution data are available.

Public Debt Operations – July 2019

Public Debt Operations – July 2019

Placements of government securities and loan disbursements for USD13.1 billion were recorded during July. The International Monetary Fund (IMF) made the fourth disbursement under the Stand-By Arrangement for USD5.39 billion.

  • Treasury Bills in pesos and dollars for the equivalent of USD5.57 billion were placed through three auctions.
  • During the month, debt services amounted to USD9.2 billion, USD6.57 billion in payments of principal and USD2.64 billion in interest.
  • On July 1, approximately USD1.01 billion of interest were paid on the Discount and Cuasipar bonds.
  • The main maturities scheduled for August are Treasury bills in pesos and dollars. In addition, interest payments to the IMF for USD240 million are expected to be made.
ANALYSIS OF THE 2018 NATIONAL GOVERNMENT FINANCIAL REPORT – PUBLIC DEBT

ANALYSIS OF THE 2018 NATIONAL GOVERNMENT FINANCIAL REPORT – PUBLIC DEBT

According to data recorded in the National Government Financial Report, as of December 31, 2018, the stock of national public debt totaled USD330.59 billion, accumulating an increase of USD11.3 billion throughout that year. As a proportion of Gross Domestic Product, the debt increased 29.5 percentage points (p.p.) to reach 85.8% of GDP.

Of the USD28 billion disbursed in 2018 by the International Monetary Fund, USD7.5 billion went to strengthen the Central Bank’s reserves, and the rest to budgetary financing.

Excluding the IMF, the debt incurred with international and bilateral official organizations showed a net reduction of USD873 million in 2018. This was due to the cancellation of services with the Paris Club for USD1.9 billion, partially offset by net disbursements from the World Bank, the CAF and the IDB for USD365 million, USD312 million, and USD129 million, respectively.

The national government did not make use of the authorization to issue up to AR$14 billion in treasury bills to backup fuel and electric power imports.

Analysis of National Tax Revenue – July 2019

Analysis of National Tax Revenue – July 2019

In July, tax revenue grew in nominal terms, although it declined in real terms, as it has been the case in the last few months. However, if we compare the cumulative for 2019 against the same period of the previous year, the decrease is slower.

It is estimated that this relative improvement in the tax collection performance is linked to a higher level of activity which, according to the EMAE (Monthly Estimator of Economic Activity, prepared by INDEC), showed in April the first improvement in more than a year.

The most important feature was a 7.3% growth in Income Tax while the VAT drop (1.6%) was lower than in previous months. Even Social Security resources, which fell 9.5% in the year-on-year comparison due to the low growth of the wage bill and certain regulatory changes, recorded the smallest drop since July last year.

In relative terms, growth continued to be led by Export Duties, which rose 298.7% year-on-year. So far this year, DGI VAT collection shows significant volatility.

Skip to content